On a recent trip to North Bay, ON, I brought along LeafSpy and managed to get some data on battery heating. As #rapidGate is known, when rapid charging the Leaf, the battery heats up, sometimes by as much as 20 C, which then influences charge speed on subsequent charging sessions as Nissan very much likes to keep battery temperature below 50 C, which it does by throttling the charging speed. We peer into the data, and do some analysis on how you can manage battery heating, allowing you to take control of #rapidgate.
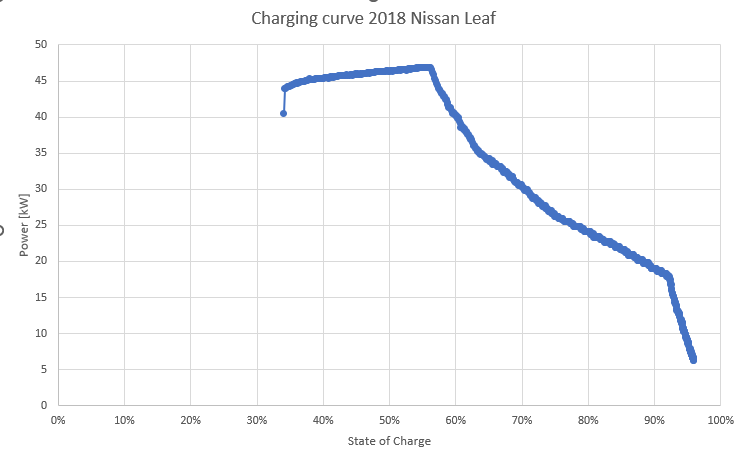
I left LeafSpy running to Monitor my rapid charging session. Using the dropbox connectivity of the LeafSpy app, I can then dive into the log data and explore how charge speed varies with state of charge, and also how charge speed relates to temperature. Nissan Leaf, as do many other EV’s ramps the charge rate down as the battery fills up. As you can see from the graph below, I plugged into the Gravenhurst charger with a little over a third remaining, charged at about 45 kW to begin with until about 55% state of charge (SOC), then ramping down, slowing below 40kW at 60%, 25 kW at 80% and 6 kW towards the end at 95%. I did feel a little bad, hogging a 50kW charger, and only charging at 6 kW, but as mine was the only EV there, with the other two charging stalls working and available, in the interest of science I kept charging.
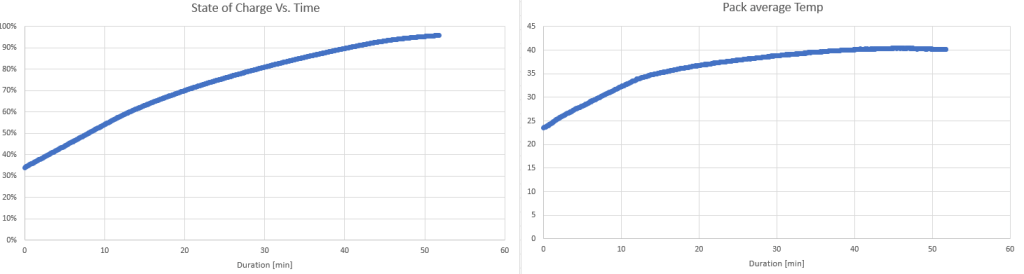
As you can see, at the start of the session to about 15 minutes in, I charge at near top speed, going very quickly to about 60% state of charge. Looking at state of charge vs Time, and battery temperature vs time below, the battery temperature also rises quickly in the beginning, then slows down as the charge rate drops, in fact below 15 kW or so, the battery actually cools off slightly.
We can also calculate the temperature change (in degree’s C per minute), as a function of charge rate.
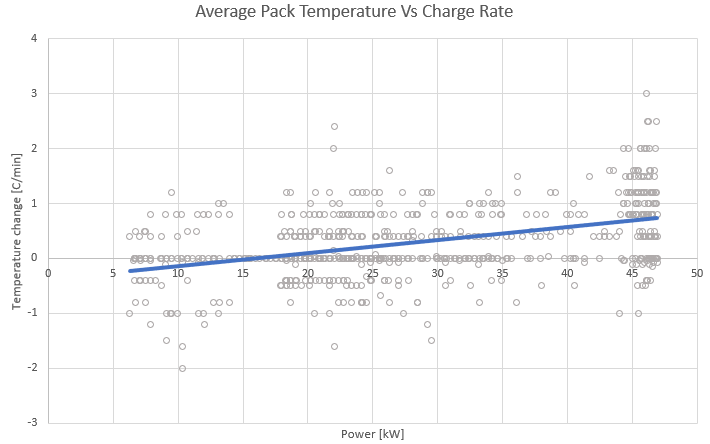
Mind you, the above graph is not perfect for various reasons, but a clear trend is seen, with the battery cooling when charge rate is below about 15 kW, and warming when above. At about 45 kW, the temperature increase “trend-line” suggests a 1C temperature increase per minute. For the first 15 minutes of my charging session, 45 kW was about my charging speed, resulting in a 15C temperature increase. Also if we left the car parked for a period of time after the charging session, the battery would cool off at a rate of about 0.3 C per minute. Granted, there is more going on here. As the battery gets warmer, it will cool faster, something we are ignoring here, also the parking spot I was parked in by the charger was actually a 45 C slab of black asphalt on a somewhat sunny day, hence the predicted 0.3C/min cooling rate when not charging might have been hard to achieve in practice.
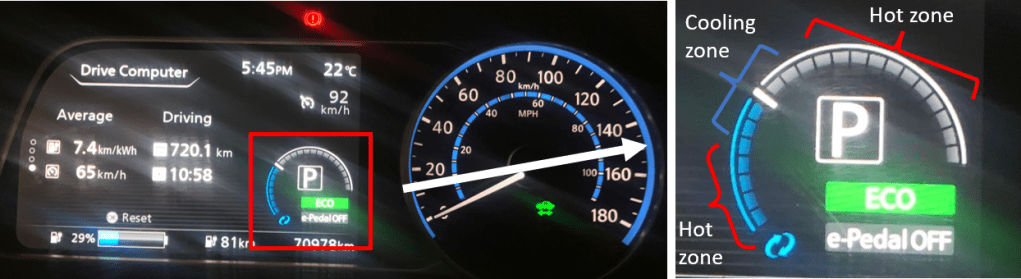
But the lesson here still holds, namely if you can keep the power level to less than say 20 kW, the Nissan Leaf’s battery is likely cooling. If you charge more often, you will start your charge at a higher state of charge, thereby charging slower. When driving, Nissan provides us with just the thing to monitor energy flows from the battery. The “bubble” energy graph on the dash. If you can keep it to the first or second bubble that corresponds to less than 20 kW flowing in or out of the battery, just what you need to keep the battery nice and cool. I find that this usually corresponds to a cruising speed of less than 90 km/hr or so, something you can usually get away with on Ontario roads.
Back to my North Bay trip. Are there any other driving strategies that would have gotten me to North Bay any faster? This is what I did: Toronto to Gravenhurst, mostly via Hwys 48 & 12, then on Hwy 11 from Gravenhurst to North Bay. Each leg is about 170 km, and I drove at a fairly steady 90 km/hr, two hours per leg, add in an hour in Gravenhurst for charging and were at 5 hours.
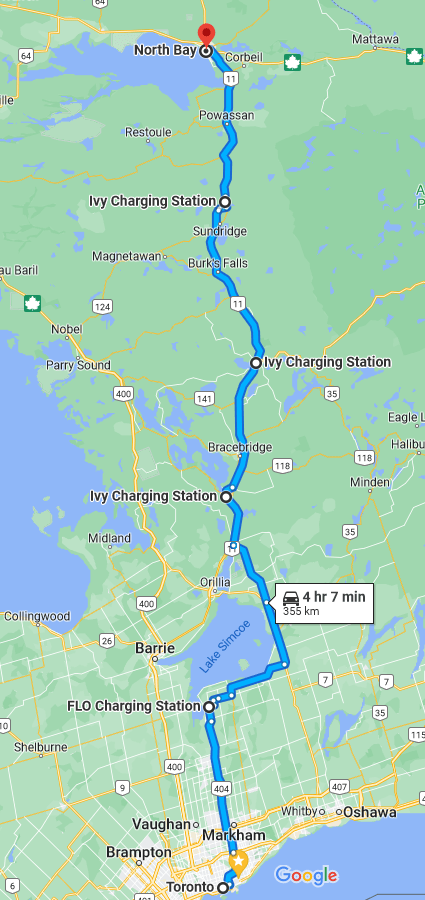
Improving charging infrastructure means that we have lots of choices. As you can see from the map above, there are three other fast chargers along the way we could have used, (there are actually more, but to keep things simple, these four will do). We consider two other possibilities: Fastest charge, and “lowest heat”.
Note that pulling into Gravenhurst, we start charging at about 30 %. That’s enough to make Huntsville, and if we did, we would have enjoyed 45 kW charge speeds for more than just 15 minutes (recall from above, that the car charges faster at a lower state of charge). As we are now 50 km closer to North Bay, we need not charge to 95%, in fact, 70% or so would do. This might happen in about 25 minutes. So we have, 4 hours of driving, and only 30 minutes of charging, for a total of 4 hours and 30 minutes, not bad.
But all that 45 kW fast charging will heat the battery a lot more than my hour long Gravenhurst stop. Which leads me to the second plan, “lowest-heat”. In an extreme situation, why not stop at all four of the fast charging stations shown at the map. This stretches our charge time to perhaps 2 hours for all the stops, arriving in North bay in 6 hours, but with a cooler battery, as our charge speeds are likely to be much less than 45 kW, in fact as each leg is now at about 100 km or so, we are plugging in at about 60-70 % state of charge, charging at an “average-power” of perhaps 25 kW.
Which plan you choose depends on the situation. With North bay being my final stop, and a need to do Groceries (which included some “singing oil” available from the LCBO in that Gravenhurst parking lot). Gravenhurst made a lot of sense. Need to get there a little quicker? Try Huntsville. Need to drive onwards from North bay? Add some extra charge stops to keep that last charge stop from stretching out into the night.
