Thinking about going solar? Confused by the terminology? Wondering if it will all pay for itself?In that case, welcome, lets discuss these basic design terms, and use real-data from my solar array to add depth to our discussion. Briefly, I have 28, 405 W panels, with 22 located on the south facing gable of my main roof, while the other 6 are on the North Facing gable. In effect, I have two-sub-arrays which then add. But they do so in interesting ways, as the sun rises, the incident angle onto my solar array becomes more favourable, reaching a peak around lunch-time, before falling in the afternoon.
Solar panels generally only deliver their peak wattage if the sun is shining in just the right spot. That spot, mathematically is along the “Normal”, which is an imaginary line drawn from the centre of your solar panel (or array), and straight up (or mathematically speaking, orthogonal to the plane of the solar panel). If the imaginary line, drawn from the centre of your solar panel (or array), towards the sun, is somewhere else, you get something closer to cos (Θ) times the ideal performance. The diagram below, shows the “Normal” line in blue, and the solar line in yellow.

This winds up looking something like a “hump” when graphed as the sun traverses the sky. At some point, the incident angle (Θ), will be as small as possible, hence cos(Θ) will be nearly 1, giving you the peak power production for the day. As the sun starts to set, production falls, reaching zero as the incidence angle (Θ) gets close to 90 degrees. Naturally at night there is no production, before starting again, as the incidence angle sinks below 90 degrees when the sun rises the next day.
With that, some basics on our solar system. We have two arrays, one oriented towards the south on our south-facing roof gable. That one has a peak output power of about 9 kW. The second smaller (2.4 kW) array is located on the north facing gable, with the panels oriented towards the west.
Thus, my array has “two humps”, which add together. Given that the larger south facing array winds up dominating the combined power output, the result is more of an elongated downward slope as you can see below.
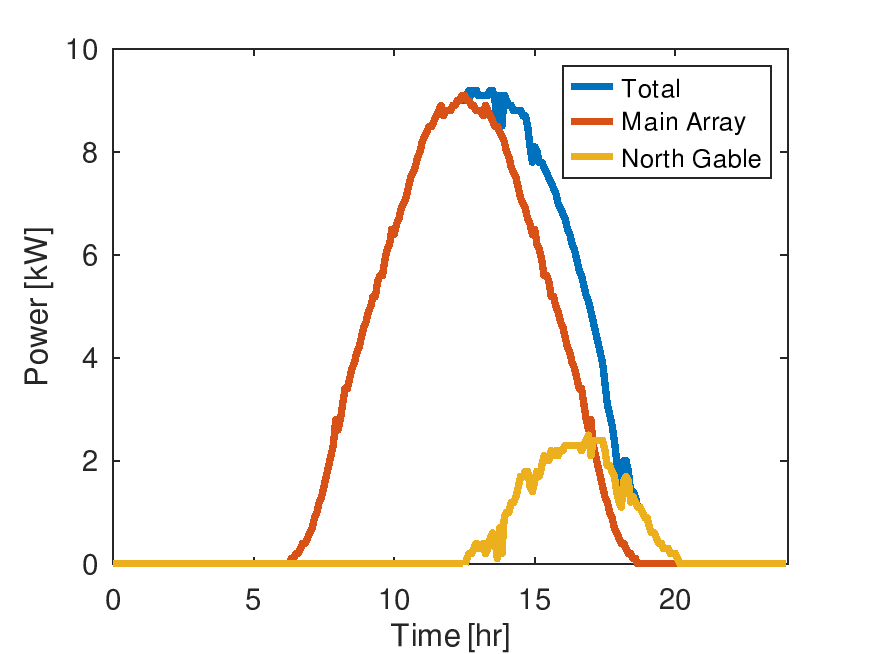
Looking at the area under these curves, we arrive at total production figures of 72 kWh, 62 kWh, 10 kWh, for whole array, the main array on the south facing gable and the west facing array on the north gable. Using the ultralow overnight tarrif, on a cloudless summer day the expected production value is $11.7 for the full system, $8.5 contributed by the south facing gable, and $2.2 by the west facing array on the north gable.
While the west facing array is only 16% of the production of the main south facing array, it produces 26% of the value of the south facing array. Mostly as production is shifted towards the more lucrative peak hours.
To be fair, it took three days of solar data to arrive at the graph shown above. Mostly as fully cloudless days are rare, also at the time of this writing my solar system is not yet exporting to the Toronto hydro system, I only manage peak production when that energy has somewhere to go, usually this involves doing laundry and charging my car.
But hope this blog has helped you better understand your solar system, if you are in the process of designing it, I recommend considering additional west facing generation if possible. If you do not happen to have a west facing gable, perhaps making use of an otherwise unremarkable north facing roof gable is a good idea?
